Gorongosa publishes its numbers piece 1 of 4
Gorongosa publishes its numbers
- Pre-war large mammal population
- one of the highest recorded in southern Africa before 1977
- Post-war nadir (early 1990s)
- estimated at 5–10% of pre-war levels, near-total loss of large ungulates and predators
- 2018 aerial survey
- more than 100,000 large mammals counted across the surveyed area
- Buffalo
- low hundreds in mid-2000s → approaching 3,000 by mid-2010s
- Lion population (2020s)
- approximately 100 individuals, individually tracked by GPS collar and camera trap
The baseline was close to zero
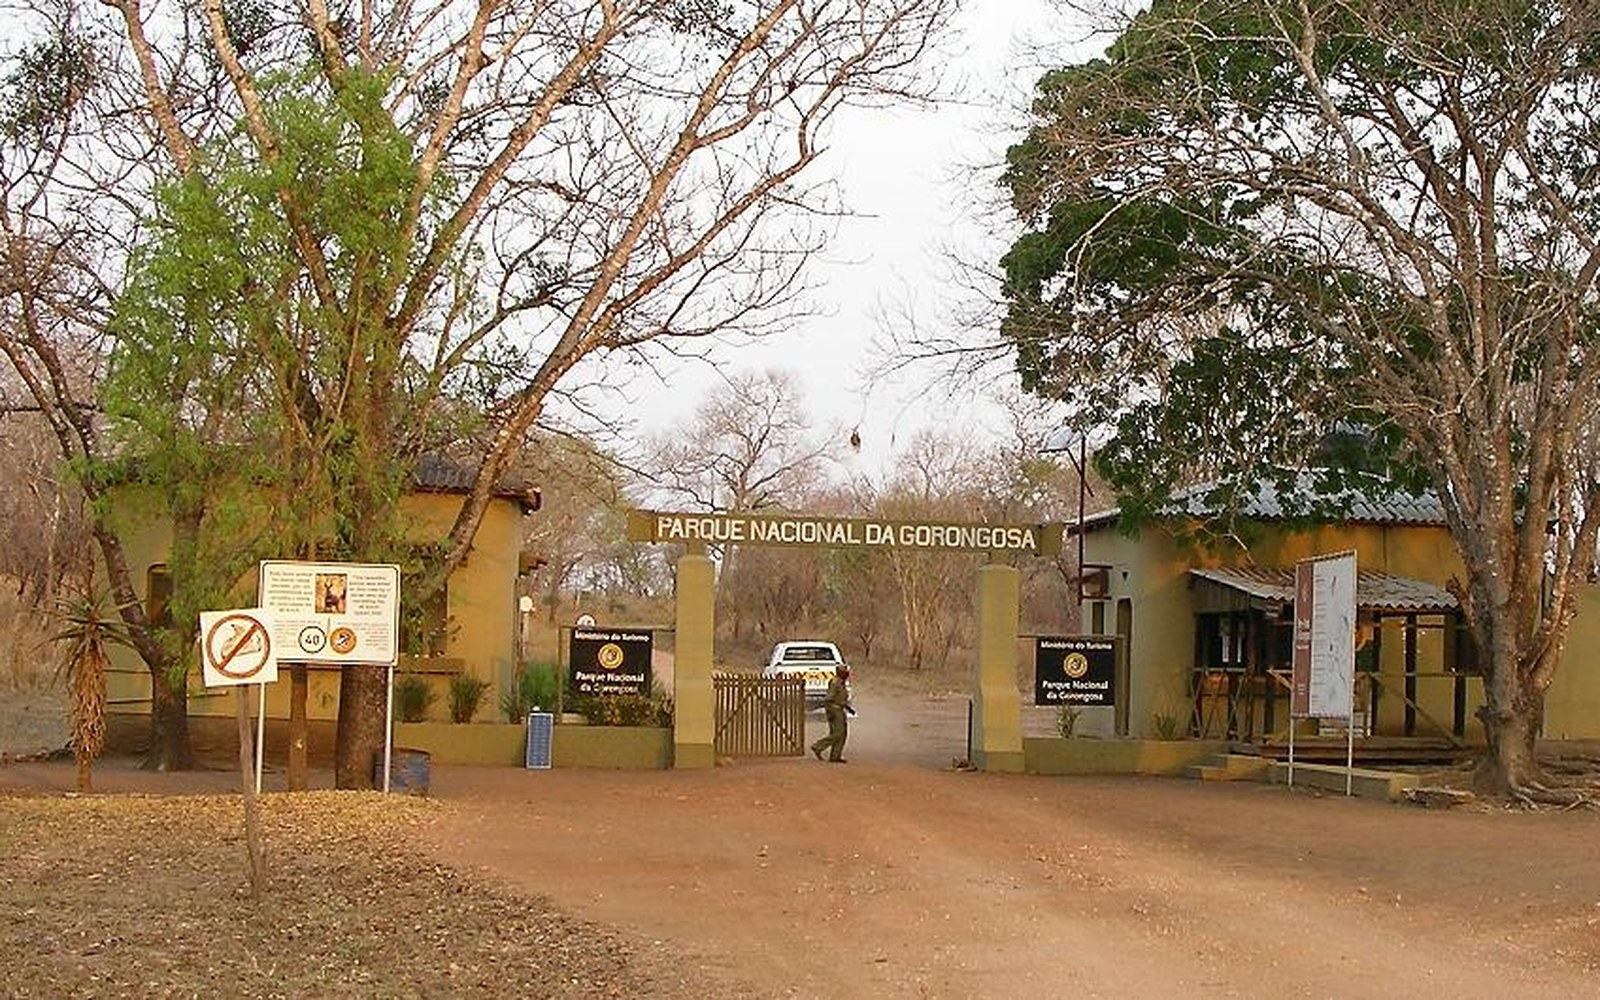
Gorongosa National Park sits at the southern end of the East African Rift, where the Urema floodplain holds one of the most productive freshwater ecosystems on the continent. Before the 1977–1992 civil war, its wildlife counts were among the most impressive in southern Africa — tens of thousands of buffalo, wildebeest and zebra moving across the floodplain, lion and leopard and wild dog behind them. By the early 1990s, when the fighting ended, most of that was gone. Animals had been killed for food by both sides and for ivory to fund the war. The park's own records, and the scientific literature published since, put the large mammal population at somewhere between five and ten percent of its pre-war level. That number is the baseline from which everything since has been measured.
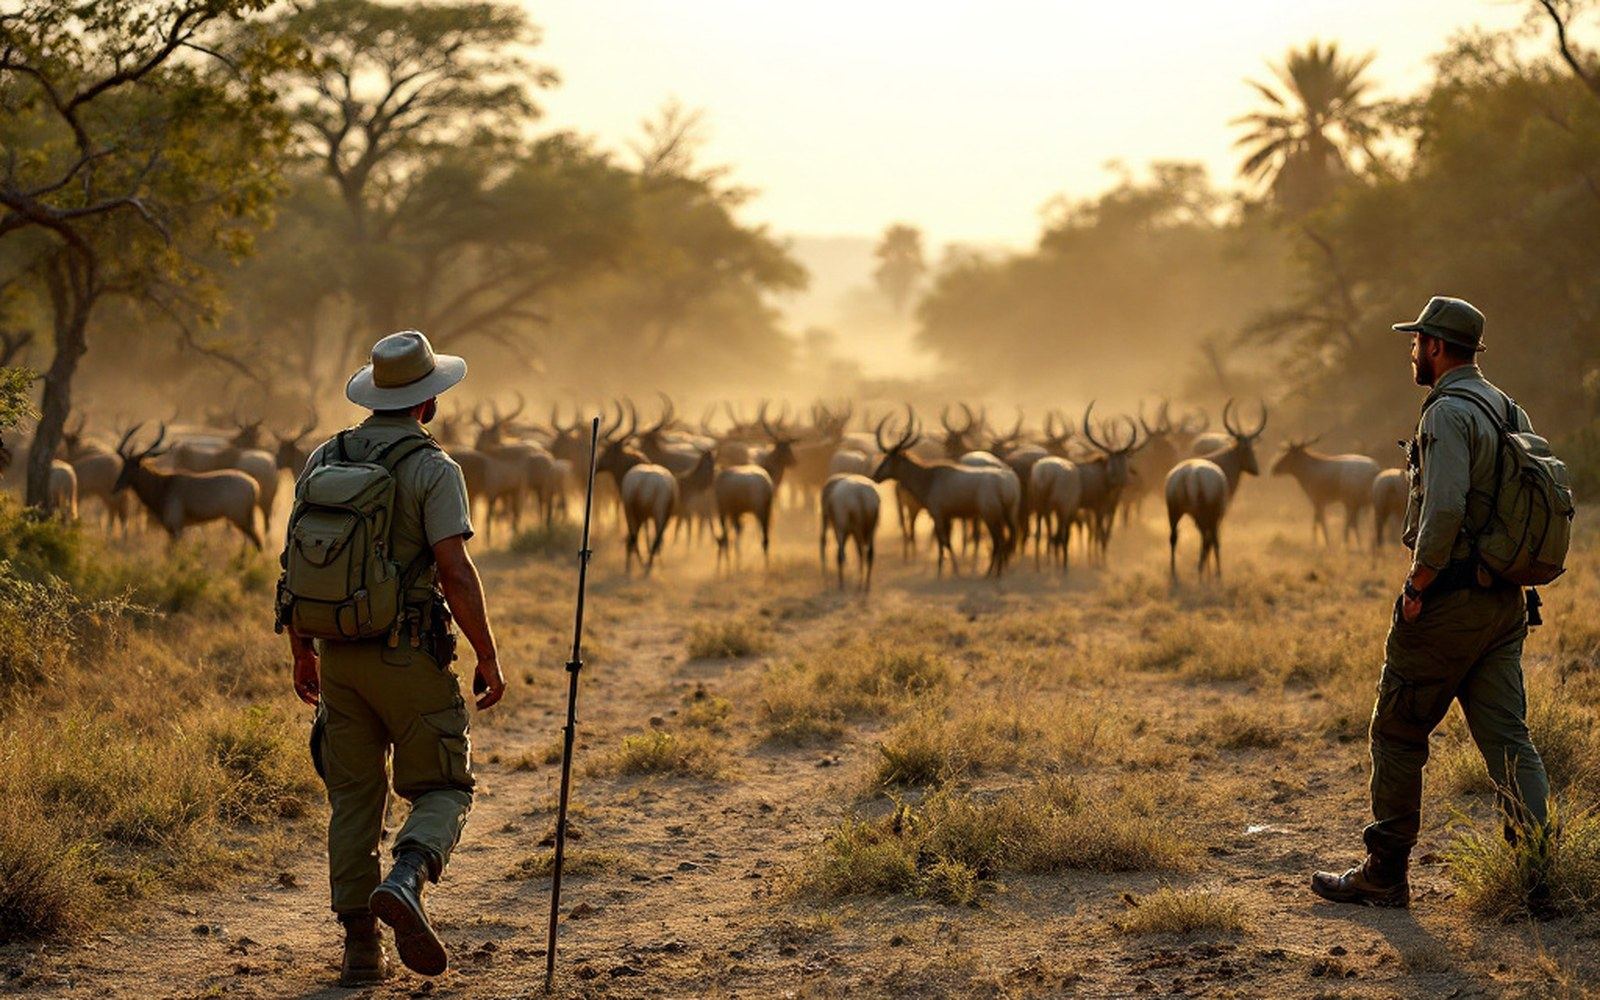
What makes Gorongosa unusual is not just the recovery — remarkable as it is — but the fact that the park publishes the counts. The Gorongosa Restoration Project, a public-private partnership between the Mozambican government and the Carr Foundation that formalised in 2008, committed from an early stage to releasing its wildlife census data openly. Aerial transect surveys — a method in which a low-flying aircraft crosses the park on parallel lines at fixed intervals while observers count every animal they can see, then statistical models scale up to a total — have been run at intervals since the early 2000s. The raw figures and the methodology are accessible, which means the recovery story is not just a narrative: it is a set of numbers anyone can interrogate.
What the counts say
The trajectory is not a smooth line. Early counts in the mid-2000s found buffalo in the low hundreds, waterbuck and impala beginning to move back across the floodplain, but large predators still largely absent and the plains ungulate populations still far below carrying capacity. By the early 2010s, the buffalo count had passed a thousand; by the mid-2010s it was climbing toward three thousand. The 2018 aerial survey — one of the most comprehensive conducted since the restoration began — recorded numbers that would have been inconceivable in 1994: more than a hundred thousand large mammals across the surveyed area, including elephants that had learned, slowly, that the park was survivable again.
Elephant recovery has been one of the more carefully watched strands of the count. Poaching pressure remained a problem into the 2010s, and the elephants that survived the war showed documented behavioural changes — heightened aggression, disrupted social structures — that researchers from several institutions have published on. The count itself is only part of the picture; the published research on post-war elephant behaviour in Gorongosa demonstrated that the war period had measurable effects on the animals that outlived it. The numbers, in other words, have a texture that the raw headcount does not capture.
By the early 2010s, the buffalo count had passed a thousand; by the mid-2010s it was climbing toward three thousand.
Lion recovery has followed a different curve. The post-war lion population was in the low single digits by some estimates, and lions were not consistently recorded in the aerial surveys until the park's protection infrastructure had been rebuilt sufficiently to reduce snaring. A camera trap and GPS collar programme run in conjunction with the aerial surveys has produced individual-level data on the lion population, and by the 2020s the park was recording around a hundred lions — a number that comes with names and known histories for many individuals, because the monitoring programme has been running long enough to track generations.
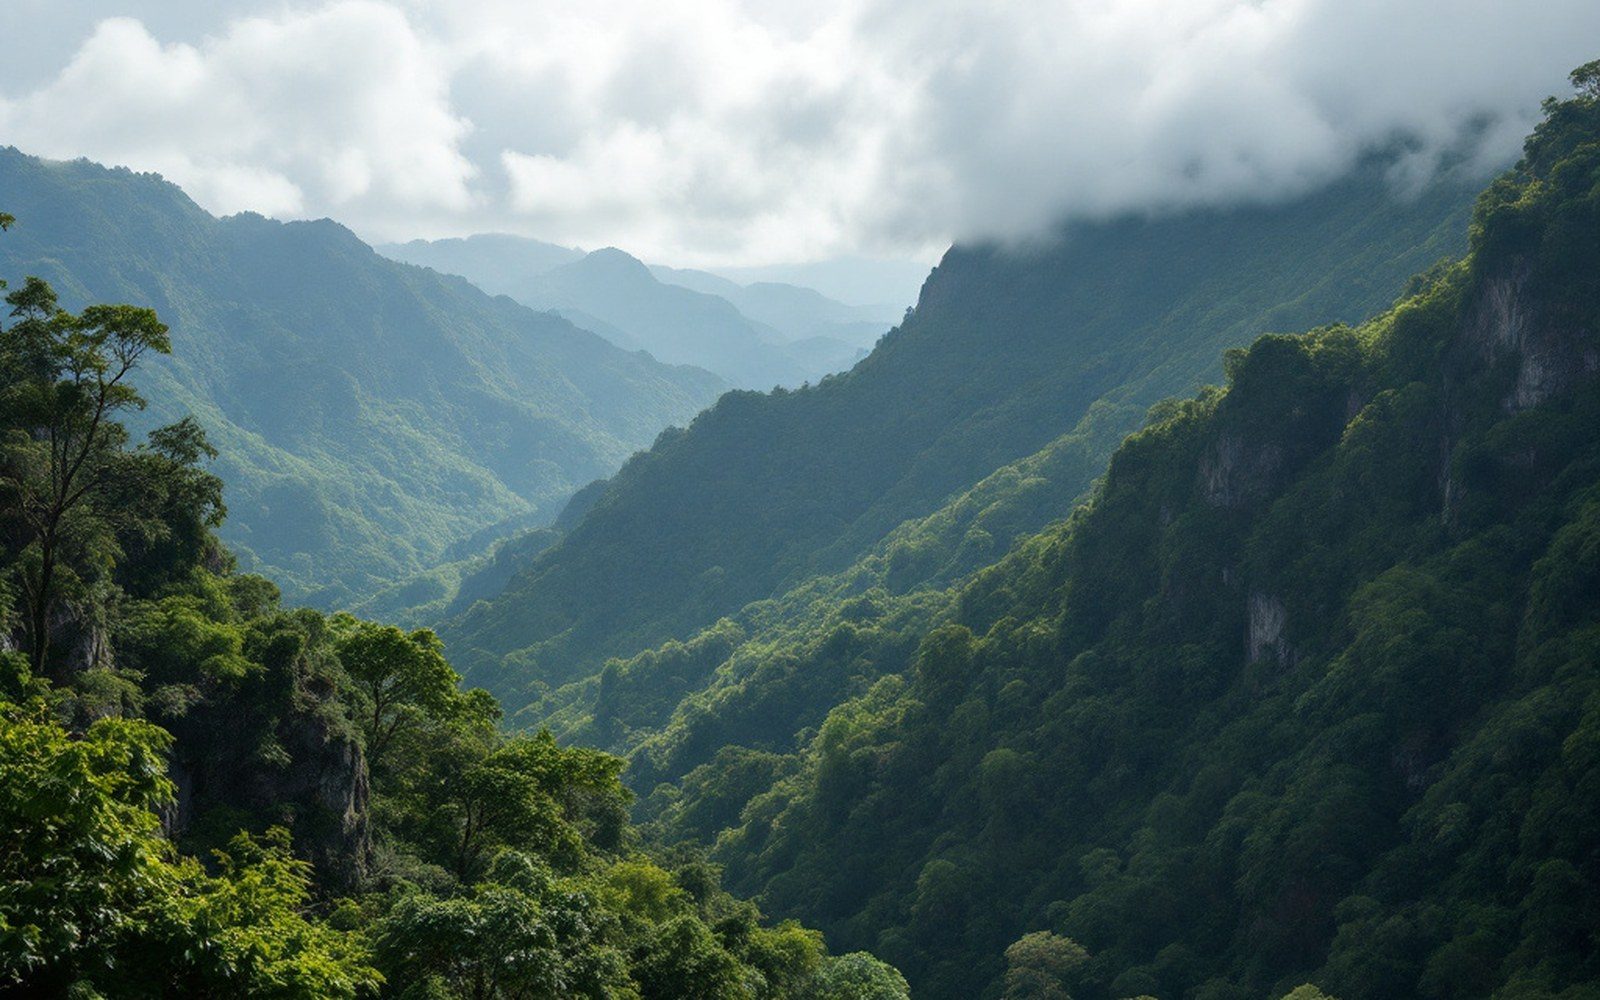
The floodplain is central to why recovery was possible at all. Lake Urema and the surrounding wetlands persist year-round at the floor of the rift, providing a permanent water source and a refuge during the dry season that keeps the ungulate populations concentrated and relatively visible to both aerial counters and ground teams. The productivity of the floodplain — driven by seasonal flooding that deposits nutrients across a wide area — gives the system a carrying capacity large enough to support the mammals currently present and, according to the park's own ecological assessments, considerably more. Above the floodplain, Mount Gorongosa carries a montane rainforest that feeds the rivers supplying the wetland below; the hydrological connection between the mountain and the floodplain is one of the reasons the restoration project has invested in forest protection outside the original park boundary.
How the method works
- Aerial transect
- aircraft flies parallel lines at fixed intervals; observers count animals in defined strip widths
- Statistical scaling
- raw counts corrected for animals hidden by vegetation or missed; output is an estimate with a confidence interval, not a direct census
- Gorongosa's surveys publish confidence intervals
- unusually transparent by regional standards
How the method shapes the story
The aerial transect method is worth understanding, because it is not a complete count — it is an estimate with a margin of error. The aircraft covers a sampled fraction of the park; observers count what they see within defined strip widths on either side; correction factors are applied for animals hidden by vegetation or missed for other reasons. The resulting figure is a model output, not a direct census. Gorongosa's published surveys include confidence intervals, which matters when reading the trajectory: a figure of 3,200 buffalo with a ninety-five percent confidence interval of ±600 is a different kind of knowledge than a figure with a narrow band. The park's openness about this uncertainty is, in the context of African wildlife management, relatively unusual.
What the data does unambiguously show is direction. The confidence intervals for successive surveys do not overlap in ways that would allow the recovery to be explained away as measurement noise. The large mammals of Gorongosa are genuinely more numerous than they were, and the rate of increase for several species has been consistent enough that the IUCN's published assessments for the specific populations present in the park reflect the improved status. That the counts are public means that outside researchers can, and do, work with them. Papers using the Gorongosa data have come from ecologists at several universities; the park's data is cited in broader studies of post-conflict wildlife recovery across the continent.
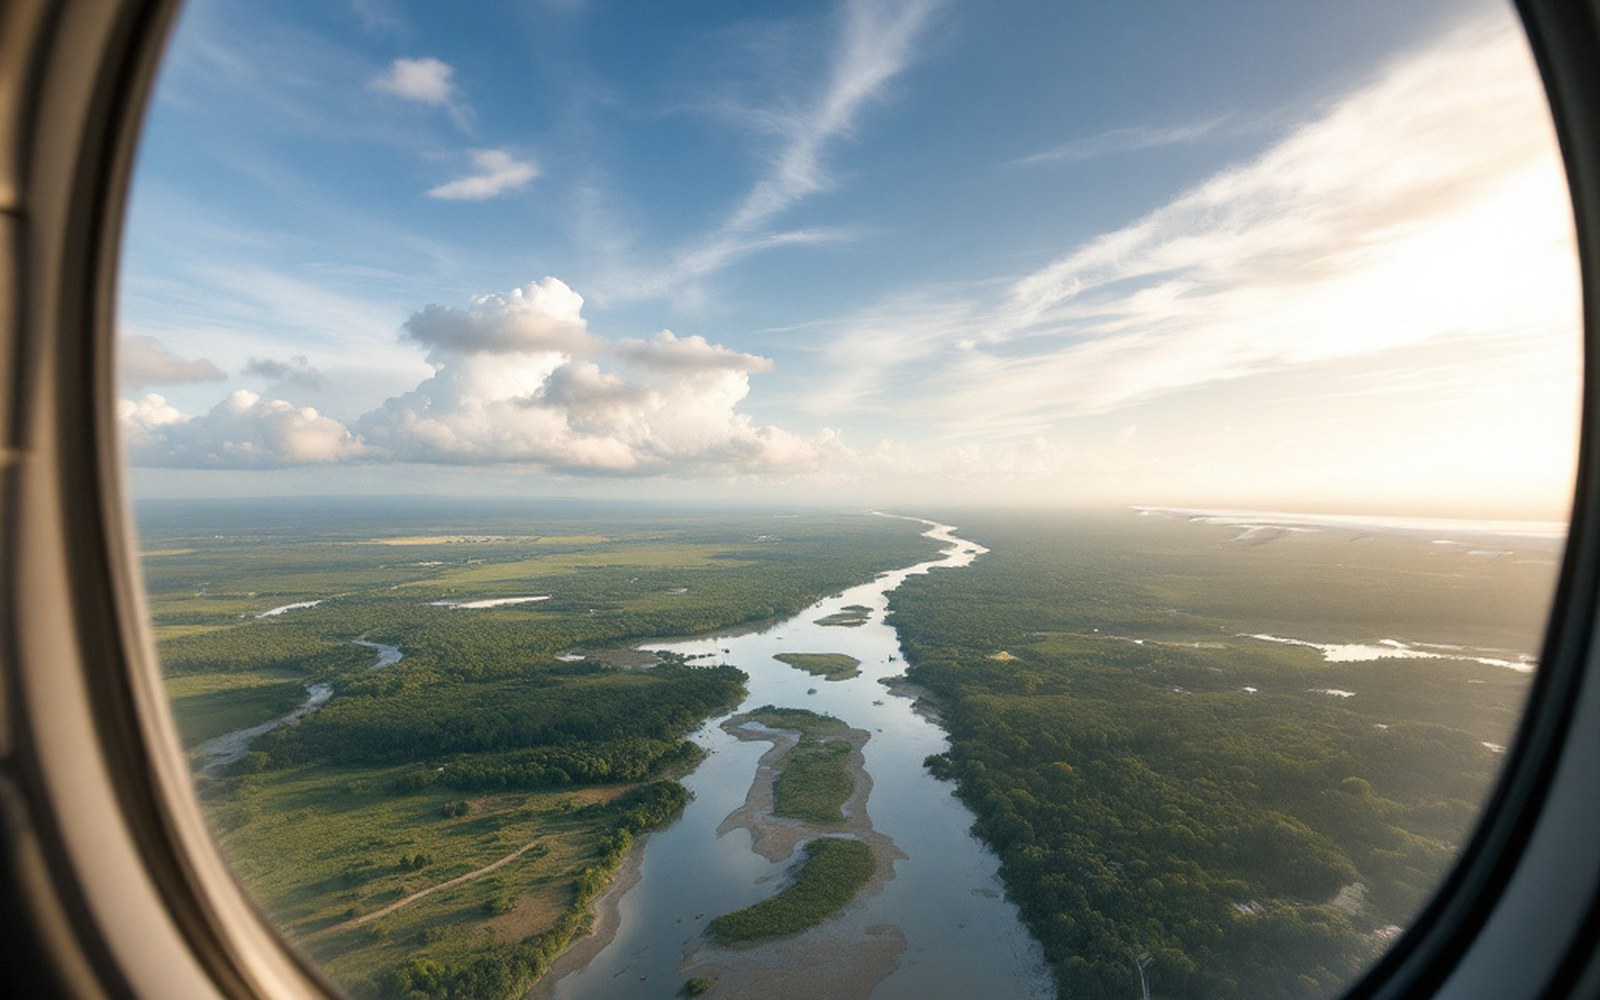
The numbers that come out of the aerial surveys each year are not a finished verdict on what Gorongosa is — the recovery is ongoing, and the pressures on the park from the surrounding landscape have not disappeared. They are, instead, a running record: of how fast a large mammal community can rebuild when the killing stops, when the water source holds, and when someone with a plane and a counting method keeps flying the same lines, year after year, and writes down what they see.
The aerial transect method is worth understanding, because it is not a complete count — it is an estimate with a margin of error.