Gorongosa publishes its numbers piece 2 of 4
Counting from the air
A line drawn across a park from a low-flying aircraft, repeated systematically, is still the most reliable way anyone has found to count large mammals across a landscape this size.
- Systematic reconnaissance flight
- the formal name for the standard aerial transect survey method used in African wildlife monitoring
- Strip width
- the corridor of ground each window observer watches; calibrated by wing-strut rods and validated against ground data
- Confidence interval
- the range within which the true population figure is estimated to fall; always present in reputable surveys, rarely quoted in headlines
- Detection rate
- the proportion of animals within the strip that observers actually see; varies by species, habitat and season
What an aerial transect actually is
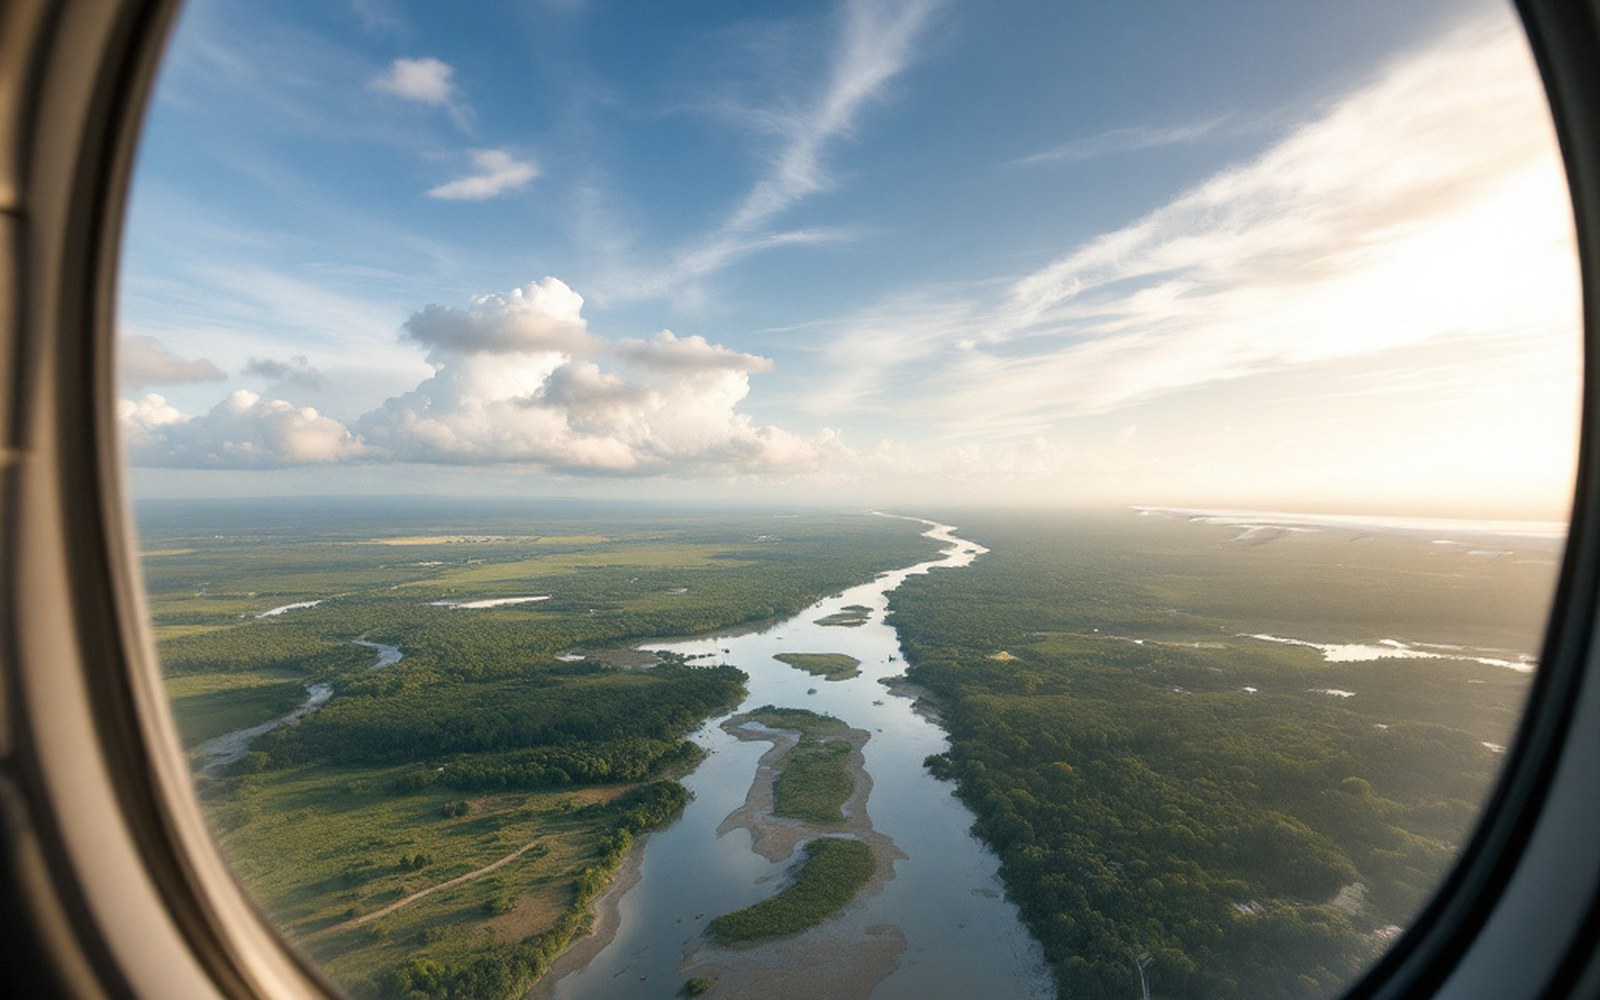
The aircraft flies at a fixed altitude — typically around 90 metres — along parallel lines spaced a set distance apart, usually between 500 metres and two kilometres depending on terrain and the density of vegetation. Two observers sit at the rear windows and watch a strip of ground defined by rods fixed to the wing struts. They call out animals; a recorder up front logs species, group size and position. The strip width is the critical variable: too wide and observers miss animals at the edge and undercount; too narrow and the survey covers too little ground to be representative. Everything depends on that calibrated strip, which is why the strip width must be validated independently — usually by ground-truthing against known positions. The method is called a systematic reconnaissance flight, and it has been the standard for large-mammal monitoring in African parks since work formalised in the 1970s.
What it produces is not a total count. It is a density estimate for each species across the flown area, extrapolated to the full park. This is worth holding in mind when reading Gorongosa's published figures: the headline number for buffalo or elephant is a statistical estimate with a confidence interval, not an individual tally. The interval is sometimes wide. A reported population of 800 buffalo with a confidence interval that runs from 600 to 1,000 is honest reporting, not hedging.
What the numbers mean in Gorongosa
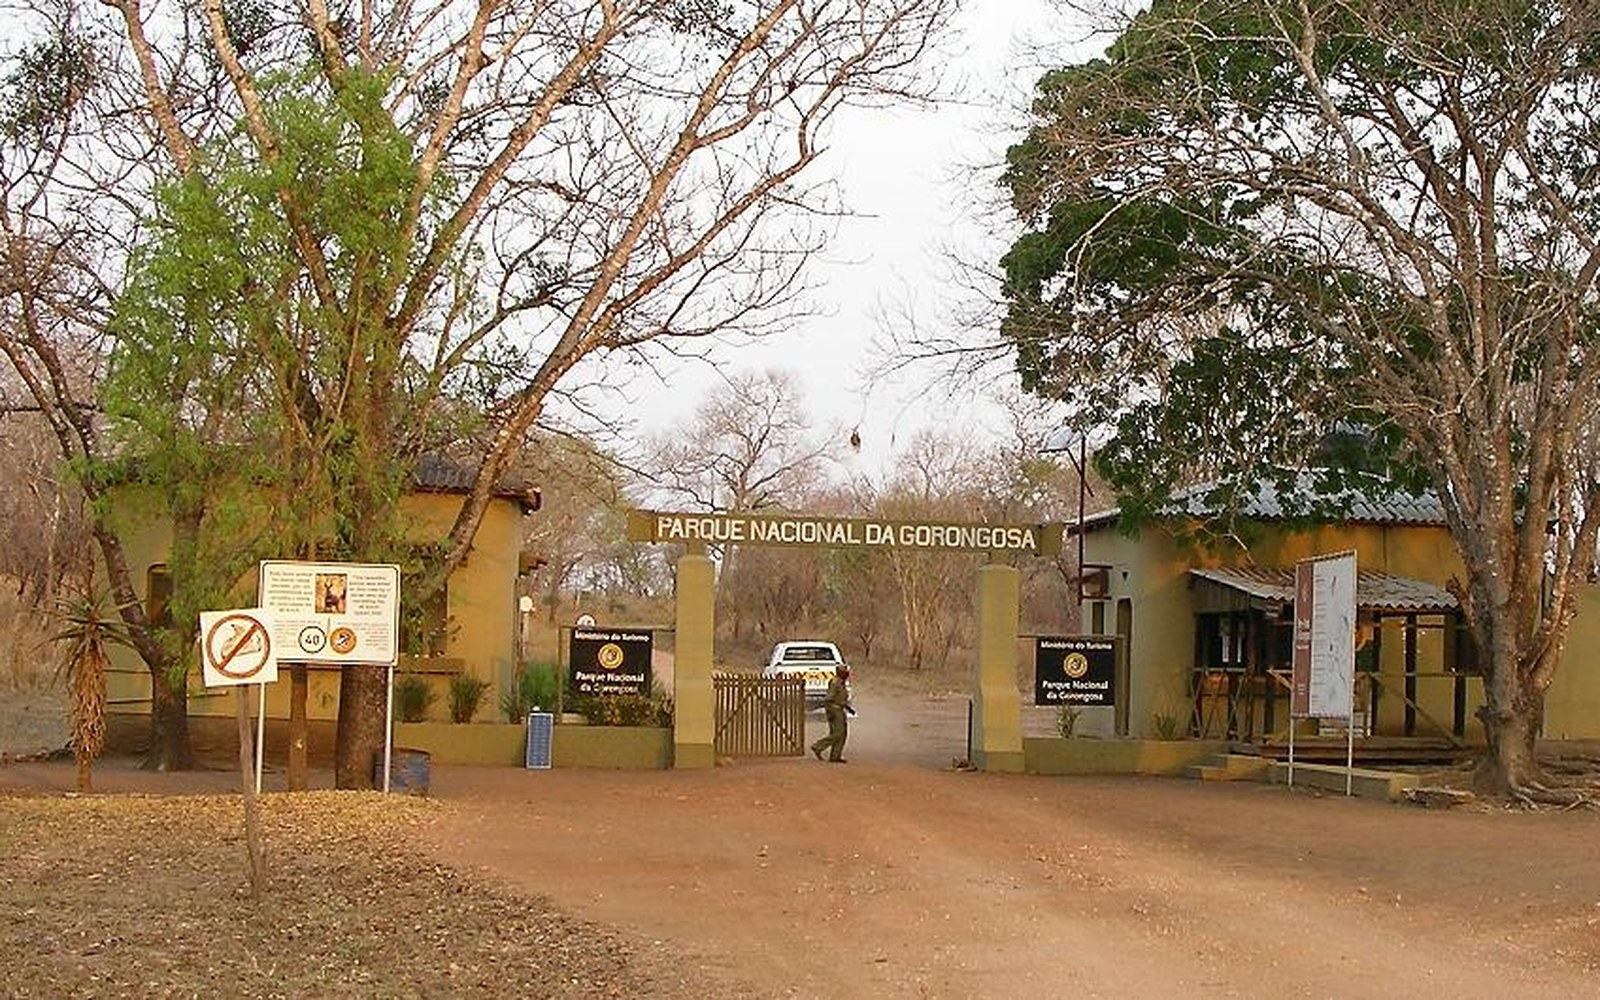
Gorongosa National Park in central Mozambique covers roughly 4,000 square kilometres of core area, with a buffer zone that extends the managed landscape considerably further. The floodplain at the park's heart — the shallow basin of Lake Urema — concentrates animals in the dry season, which is also when most surveys are flown. Visibility is better when the grass has died back, and animals cluster near permanent water, so counts during this period tend to be more reliable for large grazers. The same species are harder to count in the wet season, when the floodplain floods and animals disperse into miombo woodland on higher ground, where tree cover reduces detection rates substantially.
Before Mozambique's civil war, which ended in 1992, Gorongosa's wildlife had been counted in earlier decades at figures that included tens of thousands of large mammals. By the mid-1990s, surveys recorded a collapse of more than 95 percent across most species. The aerial transect is the instrument that documented that near-total loss, and it is the same instrument tracking the recovery. Buffalo numbers counted in the low hundreds in the early 2000s had grown to the low thousands within fifteen years. The count is not the only measure — camera traps, track stations and ranger sightings all contribute — but the aerial transect is what produces the official, comparable, time-series figure.
Hippo counts from the air require different survey conditions than buffalo counts.
The limits the method carries
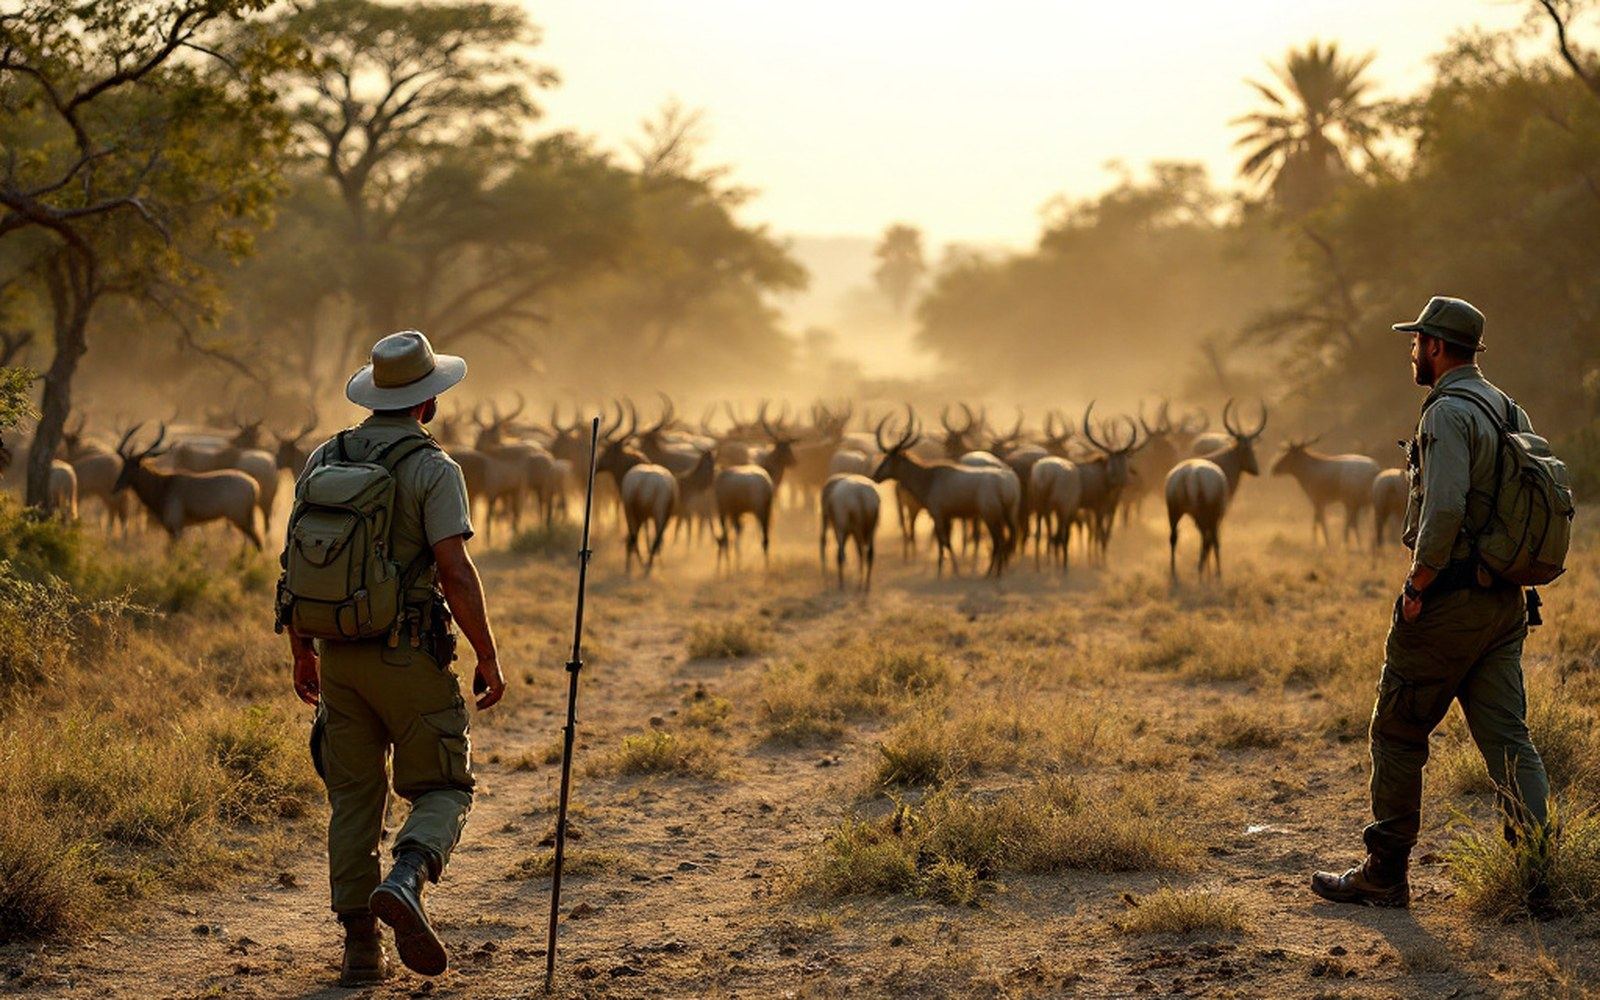
Aerial transects count what observers can see. That excludes small mammals entirely. It produces unreliable results for species that conceal themselves in woodland — leopard and lion are systematically undercounted even in good conditions, and lions in Gorongosa's miombo are far harder to detect than lions on an open floodplain. Hippo counts from the air require different survey conditions than buffalo counts. Elephant can be missed under canopy. The method is well suited to large, open-country grazers — waterbuck, zebra, hartebeest, wildebeest — and those are precisely the species Gorongosa's recovery narrative has centred on, partly because they are recoverable and partly because they are countable.
A figure that gets published from an aerial survey has already passed through several interpretive steps: strip-width assumption, detection-rate correction, density-to-area extrapolation, and confidence-interval calculation. The number at the end is real, but it is a constructed real — which is what makes it useful, provided the construction is consistent across surveys. Consistency is the point. A survey run the same way in 2005 and in 2025 tells you whether the population went up or down. It does not tell you exactly how many animals you would count if you could walk every hectare. No survey does.
| ~4,000 km² | approximate core area of Gorongosa National Park |
|---|---|
| ~90 m | typical flying altitude for a large-mammal transect survey |
| 500 m–2 km | typical spacing between parallel transect lines, adjusted to terrain and vegetation |
| >95% | estimated collapse in large-mammal populations at Gorongosa by the mid-1990s |
It does not tell you exactly how many animals you would count if you could walk every hectare.